Cycle Time
Speed up by seeing where things slow down
Cycle times show where we can improve by alerting us when things slow down. By tracking cycle times, you can boost your engineering teams performance by pinpointing where work is becoming bottlenecked.
“Time spent working hard is often better spent identifying where the bottleneck is located.” by James Clear
What is cycle time?
Cycle time measures the time from the start of an activity to the end. In a project, the cycle time tracks a task's length from going from “in progress” to reaching “done”.
Mental model on cycle time
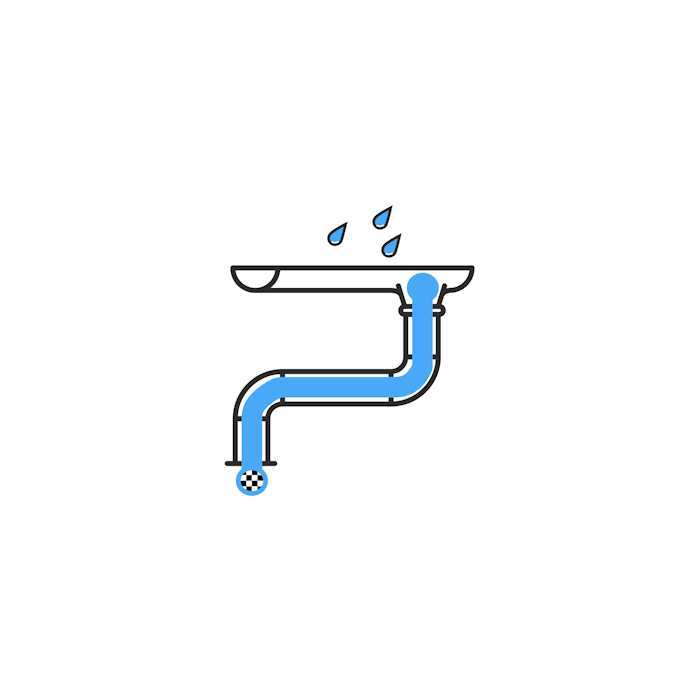
You can see how cycle time reveals where things are slowing down by using the example of water flowing through a drainpipe on the side of a house. Let’s say our cycle time runs from when the water enters the gutter and ends when it reaches the drain. When it rains, the water falls into the gutter, down the pipe and quickly empties into the drain. Our cycle time is low as the water doesn’t hang around in the gutter. But when it rains heavily enough, the pipe will reach its maximum capacity, and the gutter will begin to fill. The water will take longer to reach the drain, increasing the cycle time.
How seeing cycle time helps us see bottlenecks
Like the drainpipe, teams have a limited capacity. Cycle times will remain consistent when teams are under or near capacity. However, cycle times increase when the team reaches capacity and work starts to take longer to reach completion. As we can use cycle time as an indirect gauge of capacity, we can look into what is causing that bottleneck.
You can then decide whether to:
- Add more people (increase the capacity of the pipe).
- Reduce the amount of work you start or take on (reduce the amount of water falling into the gutter)
- Identify areas of improvement for the team (unblock the pipe).
- Or spin up another team (add another drainpipe).
Closing thoughts
Tracking cycle time is just one of many velocity metrics. It combines well with other metrics like lead time, which tracks the time a customer requests a feature to its delivery. When tracking these metrics, we can use helpful tools such as cumulative flow diagrams that clearly show how a project is progressing and where the bottlenecks might be occurring: https://kissflow.com/project/agile/guide-to-cumulative-flow-diagram/